Tangerang house price prediction

Predicting houses in Tangerang with more than 40 regions based on a real dataset scraped from one of the largest online house listings in Indonesia.
regression
machine-learning
data-science
web-scrap
Author

Vertikal

Published

October 10, 2023

This is my first end-to-end project with a scraped dataset. I used Scrapy as my scraping tool to collect data from one of the largest house listing websites in Indonesia. The most challenging part of this project was cleaning the data, as it had many missing values that required careful imputation.

One of the most important lessons I learned in this project is the significance of sample selection. When training a machine learning model, we typically split the data into a training and test set. If the model performs well on both sets, we may consider it to be a good model, which could be true. However, when we apply the model to new test data from different samples, the results may not meet our expectations. This issue doesn’t stem from the machine learning algorithm itself but rather from the initial sample selection, which may not accurately represent the population.

For scrapy installation and setup for this project please visit : Github link

Presentation slide: (go full screen by clicking 3-dot option button and choose ‘Full Screen’)

Table Of Contents

• Introduction
• Data Preparation
• Basic exploratory data analysis
    • Descriptive statistic
    • Univariate analysis
    • Multivariate analysis
• Deep-dive exploratory data analysis
• Modelling
    • Model building combination 1
    • Model building combination 2
    • Model building combination 3
    • Model building combination 4
    • Model building combination 5
    • Model building combination 6
• Choosing the best model combination
• Model evaluation and interpretation
    • Residuals plot
    • PDP & ICE plots
• Conclusion

Introduction

This project revolves around predicting house prices in Tangerang City, which encompasses more than 40 regions. The data for this project was gathered by scraping information from one of Indonesia’s largest online real estate listing platforms. After conducting this exploratory phase, I will deploy an application publicly to assist people in estimating house prices.

Data Preparation

Importing libraries, cleaning data and choosing features.

Code
#import libraries
import numpy as np
import pandas as pd
import ast
import re
from sklearn.impute import KNNImputer
import matplotlib.pyplot as plt
import matplotlib as mpl
import seaborn as sns
import warnings
from sklearn.model_selection import train_test_split, GridSearchCV
from sklearn.linear_model import LinearRegression, Ridge
from sklearn.metrics import mean_squared_error, r2_score, mean_absolute_error, mean_absolute_percentage_error
from sklearn.preprocessing import MinMaxScaler, PolynomialFeatures
from xgboost import XGBRegressor
import xgboost as xgb
from sklearn.svm import SVR
from sklearn.ensemble import RandomForestRegressor, AdaBoostRegressor
import plotly.express as px
import matplotlib.patches as mpatches
from pdpbox import pdp

#set some library settings
warnings.filterwarnings("ignore")
pd.set_option('display.max_columns', None)
sns.set()
sns.set_style('darkgrid')
mpl.rcParams['figure.dpi'] = 150 
plt.rc('legend',**{'fontsize':10})
Code
#read csv
df = pd.read_csv('tangerang.csv')
Code
#first look of data
df.head()
harga alamat fasilitas spesifikasi
0 Rp 2,6 Miliar BSD City, Tangerang Tempat Jemuran,Keamanan 24 jam,Playground,Wast... [['Kamar Tidur', '3'], ['Kamar Mandi', '2'], [...
1 Rp 20 Miliar BSD City, Tangerang NaN [['Kamar Tidur', '5'], ['Kamar Mandi', '5'], [...
2 Rp 1,68 Miliar BSD City, Tangerang Taman,Tempat Jemuran,Keamanan 24 jam [['Kamar Tidur', '2'], ['Kamar Mandi', '2'], [...
3 Rp 1,61 Miliar BSD City, Tangerang Taman,Tempat Jemuran,Keamanan 24 jam [['Kamar Tidur', '4'], ['Kamar Mandi', '3'], [...
4 Rp 2,14 Miliar BSD City, Tangerang Taman,Tempat Jemuran,Keamanan 24 jam [['Kamar Tidur', '3'], ['Kamar Mandi', '3'], [...
Code
#change 'spesifikasi' to type list and explode it to become columns
df['spesifikasi'] = df.spesifikasi.apply(ast.literal_eval)
df = df.explode('spesifikasi')
Code
#split into 'keterangan' and 'qty'
df['keterangan'] = df.spesifikasi.str[0]
df['qty'] = df.spesifikasi.str[1]
Code
df_columns = df[['harga','alamat','fasilitas']].reset_index().drop_duplicates('index').set_index('index')
df_pivot = df.pivot(columns='keterangan', values='qty').rename_axis(None, axis=1)
df = pd.concat([df_columns, df_pivot], axis = 1)

Code above is about to transform ‘keterangan’ into several columns.

Code
#new transformed dataframe
df.head()
harga alamat fasilitas Carport Dapur Daya Listrik Garasi Hadap Hook ID Iklan Jumlah Lantai Kamar Mandi Kamar Mandi Pembantu Kamar Pembantu Kamar Tidur Kondisi Perabotan Kondisi Properti Konsep dan Gaya Rumah Lebar Jalan Luas Bangunan Luas Tanah Material Bangunan Material Lantai Nomor Lantai Pemandangan Periode Sewa Ruang Makan Ruang Tamu Sertifikat Sumber Air Tahun Di Renovasi Tahun Dibangun Terjangkau Internet Tipe Properti
0 Rp 2,6 Miliar BSD City, Tangerang Tempat Jemuran,Keamanan 24 jam,Playground,Wast... 1 NaN NaN NaN NaN Tidak hos14814642 1 2 2 1 3 NaN Bagus Minimalis Modern 3 Mobil 91 m² 91 m² Batako Granit NaN Taman Kota NaN Ya Ya Lainnya (PPJB,Girik,Adat,dll) PAM atau PDAM NaN NaN Ya Rumah
1 Rp 20 Miliar BSD City, Tangerang NaN NaN 2 7700 Watt NaN NaN Tidak hos13101318 2 5 1 1 5 Unfurnished Bagus NaN NaN 465 m² 396 m² NaN NaN NaN NaN NaN Ya Ya Lainnya (PPJB,Girik,Adat,dll) PAM atau PDAM NaN NaN Tidak Rumah
2 Rp 1,68 Miliar BSD City, Tangerang Taman,Tempat Jemuran,Keamanan 24 jam 1 1 1300 Watt NaN Utara Tidak hos14850708 1 2 NaN NaN 2 Unfurnished Bagus NaN NaN 70 m² 105 m² NaN NaN NaN NaN NaN Ya Ya HGB - Hak Guna Bangunan PAM atau PDAM NaN NaN Tidak Rumah
3 Rp 1,61 Miliar BSD City, Tangerang Taman,Tempat Jemuran,Keamanan 24 jam 1 1 2200 Watt NaN Timur Laut Tidak hos14850789 2 3 NaN NaN 4 Unfurnished Bagus NaN NaN 174 m² 144 m² NaN NaN NaN NaN NaN Ya Ya SHM - Sertifikat Hak Milik PAM atau PDAM NaN NaN Tidak Rumah
4 Rp 2,14 Miliar BSD City, Tangerang Taman,Tempat Jemuran,Keamanan 24 jam 1 1 5500 Watt NaN Utara Tidak hos14003997 3 3 NaN 1 3 Unfurnished Bagus NaN NaN 170 m² 105 m² NaN NaN NaN NaN NaN Ya Ya SHM - Sertifikat Hak Milik PAM atau PDAM NaN NaN Tidak Rumah
Code
#remove duplicate data / 'iklan' (ads)
df = df.drop_duplicates('ID Iklan').reset_index(drop=True)
Code
df.insert(3, 'komplek', df[['fasilitas']].fillna('none').apply(lambda z: 'ya' if any([x in z.fasilitas.lower() for x in ['lapangan','gym','jogging','playground','one gate system']]) else 'tidak', axis = 1))
df.insert(1, 'Kecamatan', df.alamat.str.split(',').str[0])
df.insert(2, 'Kota', df.alamat.str.split(',').str[1])
df.drop(columns=['alamat','fasilitas'], inplace=True)

Create 3 new columns:
1.’komplek’ = check if the house is in a ‘komplek’ or not.
2.’Kecamatan’ = ‘kecamatan’ of the address.
3.’Kota’ = ‘kota’ of the address.

Code
#ensure the selected city is Tangerang
df = df[df.Kota == ' Tangerang']
df.drop(columns = ['Kota'], inplace=True)
Code
df.info()
<class 'pandas.core.frame.DataFrame'>
Index: 22667 entries, 0 to 22673
Data columns (total 34 columns):
 #   Column                 Non-Null Count  Dtype 
---  ------                 --------------  ----- 
 0   harga                  22667 non-null  object
 1   Kecamatan              22667 non-null  object
 2   komplek                22667 non-null  object
 3   Carport                14104 non-null  object
 4   Dapur                  12157 non-null  object
 5   Daya Listrik           18287 non-null  object
 6   Garasi                 6450 non-null   object
 7   Hadap                  8528 non-null   object
 8   Hook                   18764 non-null  object
 9   ID Iklan               22667 non-null  object
 10  Jumlah Lantai          20569 non-null  object
 11  Kamar Mandi            21871 non-null  object
 12  Kamar Mandi Pembantu   8945 non-null   object
 13  Kamar Pembantu         9597 non-null   object
 14  Kamar Tidur            21864 non-null  object
 15  Kondisi Perabotan      16139 non-null  object
 16  Kondisi Properti       19797 non-null  object
 17  Konsep dan Gaya Rumah  9493 non-null   object
 18  Lebar Jalan            12045 non-null  object
 19  Luas Bangunan          22624 non-null  object
 20  Luas Tanah             22658 non-null  object
 21  Material Bangunan      7709 non-null   object
 22  Material Lantai        8380 non-null   object
 23  Nomor Lantai           0 non-null      object
 24  Pemandangan            9987 non-null   object
 25  Periode Sewa           1 non-null      object
 26  Ruang Makan            11288 non-null  object
 27  Ruang Tamu             18765 non-null  object
 28  Sertifikat             22489 non-null  object
 29  Sumber Air             13236 non-null  object
 30  Tahun Di Renovasi      2856 non-null   object
 31  Tahun Dibangun         8878 non-null   object
 32  Terjangkau Internet    18761 non-null  object
 33  Tipe Properti          22667 non-null  object
dtypes: object(34)
memory usage: 6.1+ MB

There are 29 missing columns. After carefully reviewing each house one by one in the context, I categorized the missing columns into:

1.Missing Completely At Random
This means that the values are not input by the users due to accidents, forgetfulness, or oversight. These columns are:
Daya Listrik, Kamar Mandi, Kamar Tidur, Luas Bangunan, Luas Tanah, Sertifikat, Sumber Air, Hook

2.Missing At Random
This means that the values are not input by the users because these values can be obtained from other sources, such as photos or other information. These columns are:
Carport, Dapur, Garasi, Kamar Mandi Pembantu, Kamar Pembantu, Kondisi Perabotan, Kondisi Properti, Jumlah Lantai, Ruang Makan, Ruang Tamu

3.Missing Not At Random
This means that the values are not input by the users because they either do not know the value or they perceive it as unimportant to input the value. These columns are:
Konsep dan Gaya Rumah, Hadap, Lebar Jalan, Material Bangunan, Material Lantai, Nomor Lantai, Pemandangan, Periode Sewa, Tahun Di Renovasi, Tahun Dibangun, Terjangkau Internet ***

Code
#create a function to categorize multiple 'perabot' conditions into more general category
def perabot(kondisi):
    kondisi = str(kondisi)
    if kondisi.lower() in ['unfurnished','butuh renovasi']:
        return 'Unfurnished'
    elif kondisi.lower() in ['furnished','bagus','bagus sekali','baru','sudah renovasi','semi furnished']:
        return 'Furnished'
    else:
        return np.nan

df['Kondisi Perabotan'] = df[['Kondisi Perabotan']].apply(lambda x: perabot(x['Kondisi Perabotan']), axis = 1)
Code
#filtered only houses and not other property
df = df[df['Tipe Properti'] == 'Rumah']
Code
#extract prices from column 'harga' into integer
def price_extract(price):
    if "Triliun" in price:
        numbers = re.findall(r'\d+\.\d+|\d+', price)
        numbers = float(".".join(numbers))
        return int(numbers * 1000000)
    elif "Miliar" in price:
        numbers = re.findall(r'\d+\.\d+|\d+', price)
        numbers = float(".".join(numbers))
        return int(numbers * 1000)
    elif "Juta" in price:
        numbers = re.findall(r'\d+\.\d+|\d+', price)
        numbers = float(".".join(numbers))
        return int(numbers * 1)      

df.insert(1, 'price',  df[['harga']].apply(lambda x: price_extract(x.harga), axis = 1))
df.drop(columns = ['harga'], inplace = True)

Here, I converted the ‘price’ column into integers and divided it by one million to make it easier to view and analyze.

Code
#move 'ID Iklan' column to left
df.insert(3, 'ID',  df['ID Iklan'])
Code
#filter Sertifikat to SHM only
df = df[df.Sertifikat == 'SHM - Sertifikat Hak Milik']
Code
#drop useless columns
df.drop(columns=['Kondisi Properti','Sertifikat','Hook','ID Iklan','Lebar Jalan','Dapur','Tipe Properti','Terjangkau Internet','Sumber Air','Ruang Tamu','Ruang Makan','Carport','Garasi','Tahun Di Renovasi','Tahun Dibangun','Hadap','Konsep dan Gaya Rumah','Material Bangunan','Material Lantai','Nomor Lantai','Pemandangan','Periode Sewa'], inplace = True, errors='ignore')
Code
df.info()
<class 'pandas.core.frame.DataFrame'>
Index: 17746 entries, 3 to 22673
Data columns (total 13 columns):
 #   Column                Non-Null Count  Dtype 
---  ------                --------------  ----- 
 0   price                 17746 non-null  int64 
 1   Kecamatan             17746 non-null  object
 2   komplek               17746 non-null  object
 3   ID                    17746 non-null  object
 4   Daya Listrik          14640 non-null  object
 5   Jumlah Lantai         16312 non-null  object
 6   Kamar Mandi           17110 non-null  object
 7   Kamar Mandi Pembantu  6714 non-null   object
 8   Kamar Pembantu        7296 non-null   object
 9   Kamar Tidur           17103 non-null  object
 10  Kondisi Perabotan     12942 non-null  object
 11  Luas Bangunan         17719 non-null  object
 12  Luas Tanah            17743 non-null  object
dtypes: int64(1), object(12)
memory usage: 1.9+ MB
Code
df = df[~df['Luas Tanah'].isna()].reset_index(drop=True)
df = df[~((df['Kamar Mandi'].isna()) & (df['Kamar Mandi Pembantu'].isna()) & (df['Kamar Pembantu'].isna()) & (df['Kamar Tidur'].isna()))].reset_index(drop=True)

I removed rows that lacked critical information, such as ‘Luas Tanah’ and the total number of ‘Kamar’.

Code
for kol in ['Kamar Mandi','Kamar Tidur']:
    df[kol] = df[kol].fillna(1)

df['Luas Bangunan'] = df['Luas Bangunan'].fillna(df['Luas Tanah'])
df['Kamar Mandi Pembantu'] = df['Kamar Mandi Pembantu'].fillna(0)
df['Kamar Pembantu'] = df['Kamar Mandi Pembantu'].fillna(0)

The columns mentioned above have a small number of missing values. I filled in the missing values for ‘Kamar Mandi’ and ‘Kamar Tidur’ with ‘1’ because there is at least one of each of them in a house. For ‘Kamar & Kamar Mandi Pembantu,’ I filled in ‘0’.

Code
df.info()
<class 'pandas.core.frame.DataFrame'>
RangeIndex: 17149 entries, 0 to 17148
Data columns (total 13 columns):
 #   Column                Non-Null Count  Dtype 
---  ------                --------------  ----- 
 0   price                 17149 non-null  int64 
 1   Kecamatan             17149 non-null  object
 2   komplek               17149 non-null  object
 3   ID                    17149 non-null  object
 4   Daya Listrik          14208 non-null  object
 5   Jumlah Lantai         15731 non-null  object
 6   Kamar Mandi           17149 non-null  object
 7   Kamar Mandi Pembantu  17149 non-null  object
 8   Kamar Pembantu        17149 non-null  object
 9   Kamar Tidur           17149 non-null  object
 10  Kondisi Perabotan     12890 non-null  object
 11  Luas Bangunan         17149 non-null  object
 12  Luas Tanah            17149 non-null  object
dtypes: int64(1), object(12)
memory usage: 1.7+ MB
Code
#If a LB is bigger than LT, I assume that the houses has more than 1 floor.
def conditions(x):
    if pd.isnull(x['Jumlah Lantai']):
        if x['Luas Bangunan'] > x['Luas Tanah']:
            return '2'
        else:
            return '1'
    else:
        return x['Jumlah Lantai']

df['Jumlah Lantai'] = df[['Jumlah Lantai','Luas Bangunan','Luas Tanah']].apply(lambda x: conditions(x) , axis = 1 )
Code
#I replaced certain ambiguous values in the 'Daya Listrik' column with 'NaN' so it can be imputed with KNN Imputer
condition = ((df['Daya Listrik'] == 'Lainnya Watt') | (df['Daya Listrik'] == 'lainnya Watt'))
df.loc[condition, 'Daya Listrik'] = np.nan
Code
#change data types
df['Daya Listrik'] = df['Daya Listrik'].str.replace('Watt','').astype('Float64')
df['Luas Bangunan'] = df['Luas Bangunan'].str.replace('m²','').astype(int)
df['Luas Tanah'] = df['Luas Tanah'].str.replace('m²','').astype(int)
Code
#impute with KNN
df['avg_bangunan'] = df.groupby('Daya Listrik')['Luas Bangunan'].transform('median').fillna(df['Luas Bangunan'])
listrik_impute = pd.DataFrame(KNNImputer(n_neighbors=1).fit_transform(df[['Daya Listrik','avg_bangunan']]))
df['Daya Listrik'] = listrik_impute[0]
df.drop(columns=['avg_bangunan'], inplace=True)
Code
#I selected only the 'Kecamatan' with more than 100 samples to ensure a reliable result
df = df[ df.groupby('Kecamatan')['price'].transform('count') > 100]
Code
df['price/m'] = df.price / (df['Luas Tanah'] + df['Luas Bangunan'])
Code
#create dictionary to map 'Kondisi Perabotan'
value_mapping = {
    'Unfurnished': 1,
    'Furnished' : 2,
}

reverse_mapping = {
    1.0 : 'Unfurnished',
    2.0 : 'Furnished',
}
Code
df['Kondisi Perabotan'] = df['Kondisi Perabotan'].map(value_mapping)
Code
for kec in df.Kecamatan.unique() :
    df1 = df[df.Kecamatan == kec][['Kondisi Perabotan','price/m']].copy().reset_index(drop=True)
    df1['price/m'] = df1.groupby(['Kondisi Perabotan'])['price/m'].transform('median').fillna(df1['price/m'])

    imputer = KNNImputer(n_neighbors = 1)
    imputer.fit(df1[['Kondisi Perabotan','price/m']])
    missing_values = df.loc[df[df.Kecamatan == kec].index,['Kondisi Perabotan','price/m']]
    df.loc[df[df.Kecamatan == kec].index,['Kondisi Perabotan','price/m']] = imputer.transform(missing_values)
        
df.reset_index(drop=True, inplace=True)
df['Kondisi Perabotan'] = df['Kondisi Perabotan'].map(reverse_mapping)

To impute missing values for ‘Kondisi Perabotan’, first gather the ‘price/m’ data for each ‘Kecamatan’. Once we have this data, we can observe that ‘Kondisi Perabotan’ prices vary significantly, with furnished properties being considerably more expensive than unfurnished ones. Then, we will use the KNN Imputer to fill in the missing values with the nearest neighbors’ values.

Code
df.drop(columns = ['price/m'], inplace = True)
Code
#change data types
df = df.convert_dtypes(convert_string = False)
for column in ['Kamar Mandi','Kamar Mandi Pembantu','Kamar Pembantu','Kamar Tidur','price','Daya Listrik','Luas Bangunan','Luas Tanah']:
    df[column] = df[column].astype(int)
Code
df.info()
<class 'pandas.core.frame.DataFrame'>
RangeIndex: 17050 entries, 0 to 17049
Data columns (total 13 columns):
 #   Column                Non-Null Count  Dtype 
---  ------                --------------  ----- 
 0   price                 17050 non-null  int64 
 1   Kecamatan             17050 non-null  object
 2   komplek               17050 non-null  object
 3   ID                    17050 non-null  object
 4   Daya Listrik          17050 non-null  int64 
 5   Jumlah Lantai         17050 non-null  object
 6   Kamar Mandi           17050 non-null  int64 
 7   Kamar Mandi Pembantu  17050 non-null  int64 
 8   Kamar Pembantu        17050 non-null  int64 
 9   Kamar Tidur           17050 non-null  int64 
 10  Kondisi Perabotan     17050 non-null  object
 11  Luas Bangunan         17050 non-null  int64 
 12  Luas Tanah            17050 non-null  int64 
dtypes: int64(8), object(5)
memory usage: 1.7+ MB
Code
df.drop(columns = 'ID', inplace = True)
df.duplicated().sum()
2877

After getting rid of the ‘ID’ column, you’ll notice there are still lots of duplicates left. It seems like the same ads are being posted multiple times. Let’s go ahead and clean those up.

Code
df = df.drop_duplicates()
Code
df.info()
<class 'pandas.core.frame.DataFrame'>
Index: 14173 entries, 0 to 17049
Data columns (total 12 columns):
 #   Column                Non-Null Count  Dtype 
---  ------                --------------  ----- 
 0   price                 14173 non-null  int64 
 1   Kecamatan             14173 non-null  object
 2   komplek               14173 non-null  object
 3   Daya Listrik          14173 non-null  int64 
 4   Jumlah Lantai         14173 non-null  object
 5   Kamar Mandi           14173 non-null  int64 
 6   Kamar Mandi Pembantu  14173 non-null  int64 
 7   Kamar Pembantu        14173 non-null  int64 
 8   Kamar Tidur           14173 non-null  int64 
 9   Kondisi Perabotan     14173 non-null  object
 10  Luas Bangunan         14173 non-null  int64 
 11  Luas Tanah            14173 non-null  int64 
dtypes: int64(8), object(4)
memory usage: 1.4+ MB
Code
df = df[df['Jumlah Lantai'].astype(int) <= 4]
Code
df.info()
<class 'pandas.core.frame.DataFrame'>
Index: 14161 entries, 0 to 17049
Data columns (total 12 columns):
 #   Column                Non-Null Count  Dtype 
---  ------                --------------  ----- 
 0   price                 14161 non-null  int64 
 1   Kecamatan             14161 non-null  object
 2   komplek               14161 non-null  object
 3   Daya Listrik          14161 non-null  int64 
 4   Jumlah Lantai         14161 non-null  object
 5   Kamar Mandi           14161 non-null  int64 
 6   Kamar Mandi Pembantu  14161 non-null  int64 
 7   Kamar Pembantu        14161 non-null  int64 
 8   Kamar Tidur           14161 non-null  int64 
 9   Kondisi Perabotan     14161 non-null  object
 10  Luas Bangunan         14161 non-null  int64 
 11  Luas Tanah            14161 non-null  int64 
dtypes: int64(8), object(4)
memory usage: 1.4+ MB
Code
df5 = df.copy()
Code
#rename columns
df.rename(columns={'Daya Listrik': 'Listrik', 
                   'Jumlah Lantai': 'Lantai',
                   'Kamar Mandi': 'KM',
                   'Kamar Mandi Pembantu': 'KMP',
                   'Kamar Pembantu': 'KP',
                   'Kamar Tidur': 'KT',
                   'Kondisi Perabotan': 'Kondisi',
                   'Luas Bangunan': 'LB',
                   'Luas Tanah': 'LT'}, inplace=True)
Code
df.info()
<class 'pandas.core.frame.DataFrame'>
Index: 14161 entries, 0 to 17049
Data columns (total 12 columns):
 #   Column     Non-Null Count  Dtype 
---  ------     --------------  ----- 
 0   price      14161 non-null  int64 
 1   Kecamatan  14161 non-null  object
 2   komplek    14161 non-null  object
 3   Listrik    14161 non-null  int64 
 4   Lantai     14161 non-null  object
 5   KM         14161 non-null  int64 
 6   KMP        14161 non-null  int64 
 7   KP         14161 non-null  int64 
 8   KT         14161 non-null  int64 
 9   Kondisi    14161 non-null  object
 10  LB         14161 non-null  int64 
 11  LT         14161 non-null  int64 
dtypes: int64(8), object(4)
memory usage: 1.4+ MB
Code
df.Kecamatan.unique()
array(['BSD City', 'Poris', 'Karang Tengah', 'Pondok Benda',
       'Tangerang Kota', 'BSD Delatinos', 'Serua', 'Karawaci', 'Jombang',
       'Cikupa', 'Curug', 'Suradita', 'Panongan', 'BSD Residence One',
       'Kelapa Dua', 'Pondok Ranji', 'Ciledug', 'Pondok Cabe',
       'Gading Serpong', 'Pagedangan', 'Legok', 'Pinang', 'Cikokol',
       'Dadap', 'BSD Foresta', 'BSD Green Wich', 'Cireundeu',
       'BSD Anggrek Loka', 'Cipondoh', 'BSD Nusaloka', 'BSD Puspita Loka',
       'Gading Serpong Pondok Hijau Golf', 'BSD The Green', 'Cipadu',
       'Larangan', 'BSD Giri Loka', 'Cikupa Citra Raya', 'Modernland',
       'Benda', 'Rempoa', 'Alam Sutera', 'BSD', 'Cisauk', 'Graha Raya',
       'Lippo Karawaci'], dtype=object)

Basic Exploratory Data Analysis

Code
#Let's split the categorical and numerical columns into separate dataframes for easier analysis.
dfnum = df._get_numeric_data()
dfcat = df.drop(columns = dfnum.columns)

Descriptive Statistic

Code
#numerical columns describe.
dfnum.describe()
price Listrik KM KMP KP KT LB LT
count 1.416100e+04 14161.000000 14161.000000 14161.000000 14161.000000 14161.000000 14161.000000 1.416100e+04
mean 4.525861e+03 3892.131205 2.717958 0.419603 0.419603 3.521715 187.472848 4.820822e+04
std 1.518706e+05 6346.367405 2.124905 0.535776 0.535776 2.272806 209.443483 5.714284e+06
min 7.000000e+00 -1300.000000 1.000000 0.000000 0.000000 1.000000 1.000000 7.000000e+00
25% 1.200000e+03 2200.000000 2.000000 0.000000 0.000000 3.000000 81.000000 8.300000e+01
50% 2.000000e+03 2200.000000 2.000000 0.000000 0.000000 3.000000 135.000000 1.260000e+02
75% 3.500000e+03 4400.000000 3.000000 1.000000 1.000000 4.000000 225.000000 2.050000e+02
max 1.800000e+07 95000.000000 99.000000 10.000000 10.000000 99.000000 8032.000000 6.800000e+08

All columns above have outliers. ‘Listrik’ column has negative value which is caused by incorrect user input

Code
df['Listrik'] = abs(df['Listrik'])
Code
dfcat.describe()
Kecamatan komplek Lantai Kondisi
count 14161 14161 14161 14161
unique 45 2 4 2
top Poris tidak 2 Unfurnished
freq 503 7852 8818 8014

There are 45 ‘Kecamatan’ used on this samples.

Univariate Analysis

Code
fig, axarr = plt.subplots(2,4, figsize=(11, 8))
for col in dfnum.columns:
    loc = dfnum.columns.get_loc(col)
    y = 0 if loc < 4 else 1
    x = loc if loc < 4 else loc - 4
    sns.boxplot(y = dfnum[col], ax = axarr[y,x])
    axarr[y, x].set_ylabel(None)
    axarr[y, x].set_xlabel(col)
plt.suptitle('Outliers checking on numeric columns', weight='bold')
fig.tight_layout(pad=1)
plt.show()

Code
#removing extreme values
df = df[(df.price < 10000)]
df = df[(df['Listrik'] < 20000)]
df = df[(df['KM'] < 10)]
df = df[(df['KMP'] <= 2)]
df = df[(df['KP'] <= 2)]
df = df[(df['KT'] <= 20)]
df = df[(df['LB'] <= 1000)]
df = df[(df['LT'] <= 1000)]
Code
dfnum = df._get_numeric_data()
dfcat = df.drop(columns = dfnum.columns)
Code
fig, axarr = plt.subplots(2,4, figsize=(11, 8))
for col in dfnum.columns:
    loc = dfnum.columns.get_loc(col)
    y = 0 if loc < 4 else 1
    x = loc if loc < 4 else loc - 4
    sns.histplot(data=dfnum[col], 
                 color='skyblue', 
                 kde=True, 
                 edgecolor='none', 
                 ax=axarr[y, x])
plt.suptitle('Distribution checking on numeric columns', weight='bold')
fig.tight_layout(pad=1)
plt.show()

We can clearly see that this data is right skewed.

Code
fig, axarr = plt.subplots(2,2, figsize=(11, 8))
for col in dfcat.columns:
    loc = dfcat.columns.get_loc(col)
    y = 0 if loc < 2 else 1
    x = loc if loc < 2 else loc - 2
    sns.countplot(x=df[col], color='green', ax = axarr[y,x], order=df[col].value_counts().iloc[:4].index)

plt.suptitle('Countplot of categorical columns', weight='bold')
fig.tight_layout(pad=1)
plt.show()

Multivariate Analysis

Code
plt.figure(figsize=(10,8))
sns.heatmap(dfnum.corr(), annot=True, fmt='.2f')
plt.title('Correlation plot', weight ='bold')
plt.xticks(rotation = 0)
plt.show()

price, LB, and LT, exhibit a strong positive correlation. Although this correlation is quite strong, it does not lead to multicollinearity issues.

Deep-Dive Exploratory Data Analysis

Code
df['KMR'] = df.KP + df.KT
df['KMD'] = df.KM + df.KMP
df['price/m'] = df.price / (df.LT + df.LB) 
df['Lantai'] = df.Lantai.astype(int)
df.drop(columns=['KM','KMP','KP','KT'], inplace=True)

I’ve developed a new feature named ‘price/m’ by dividing the price by the sum of LT and LB. This feature is more suitable for analysis compared to using just the price alone.

Code
sns.histplot(df.groupby('Kecamatan').size(), alpha=0.8)
plt.xlabel('Kecamatan Frequency')
plt.title('Kecamatan distribution count', weight='bold')
plt.show()

The plot above illustrates the distribution of samples collected from each Kecamatan. The sample size varies, with the lowest being approximately 100 and the highest reaching 500. In cases of insufficient sample size, potential issues may arise, and further analysis is necessary to determine whether these samples are adequate.

Code
fig, axarr = plt.subplots(1,2, figsize=(10, 4))
data = df.groupby('Kecamatan').size().reset_index(drop=False).sort_values(0, ascending=False)
data.columns = ['Kecamatan','count']
sns.barplot(data = data.head(15), x='count', y='Kecamatan', ax = axarr[0])
sns.barplot(data = data.tail(15), x='count', y='Kecamatan', ax = axarr[1], palette='RdBu')
axarr[0].set_title('Top 15 highest kecamatan count', weight='bold')
axarr[1].set_title('Top 15 lowest kecamatan count', weight='bold')
axarr[0].set_position([0.1, 0.1, 0.3, 0.8])
axarr[1].set_position([0.6, 0.1, 0.3, 0.8])

Code
df['Kecamatan'] = df.Kecamatan.str.replace('Gading Serpong Pondok Hijau Golf' , 'Gading Serpong PHG')
Code
fig, axarr = plt.subplots(1,2, figsize=(10, 4))
data = df.groupby('Kecamatan')[['price']].agg('median').reset_index().sort_values('price', ascending=False)
sns.barplot(data = data.head(15), x='price', y='Kecamatan', ax = axarr[0], palette='plasma')
sns.barplot(data = data.tail(15), x='price', y='Kecamatan', ax = axarr[1], palette='coolwarm')
plt.title('harga per kecamatan')
axarr[0].set_title('Top 15 highest kecamatan price', weight='bold')
axarr[1].set_title('Top 15 lowest kecamatan price', weight='bold')
axarr[0].set_position([0.1, 0.1, 0.3, 0.8])
axarr[1].set_position([0.6, 0.1, 0.3, 0.8])

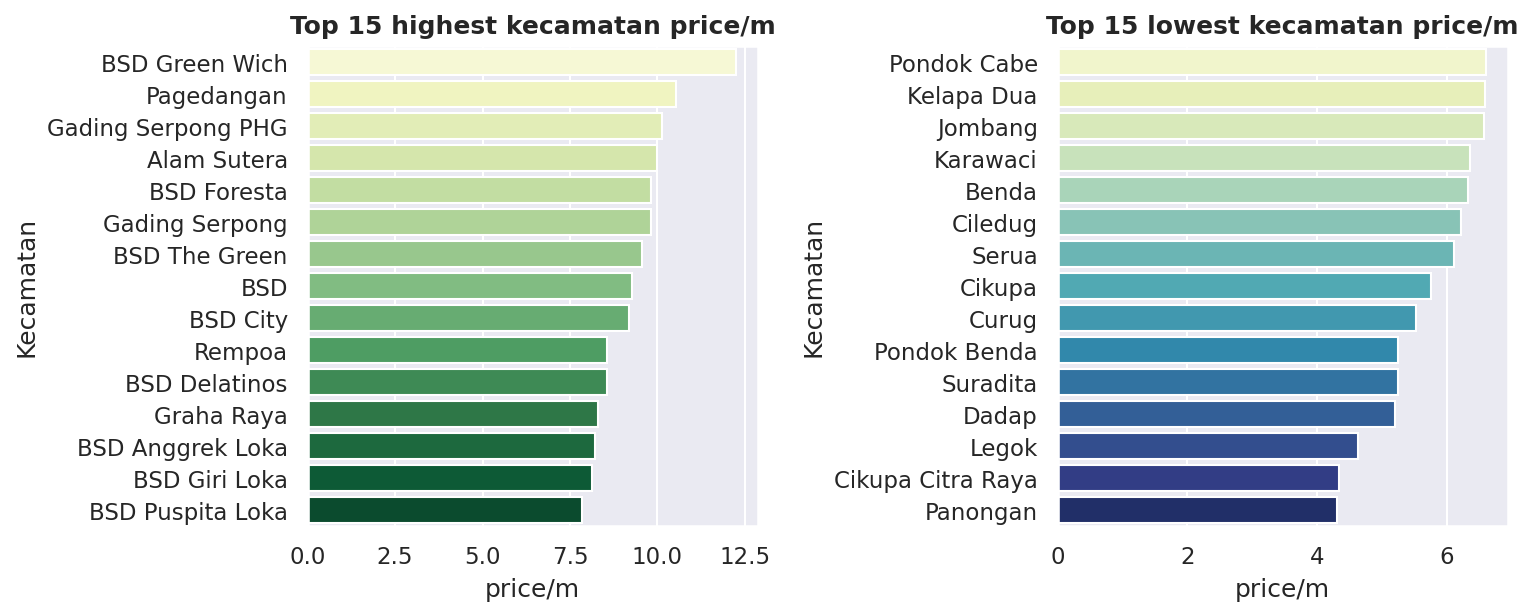
BSD is one of the most expensive region in Tangerang

Code
fig, axarr = plt.subplots(1,2, figsize=(10, 4))
data = df.groupby('Kecamatan')[['price/m']].agg('median').reset_index().sort_values('price/m', ascending=False)
sns.barplot(data = data.head(15), x='price/m', y='Kecamatan', ax = axarr[0], palette = 'YlGn')
sns.barplot(data = data.tail(15), x='price/m', y='Kecamatan', ax = axarr[1], palette = 'YlGnBu')
plt.title('harga meteran per kecamatan')
axarr[0].set_title('Top 15 highest kecamatan price/m', weight='bold')
axarr[1].set_title('Top 15 lowest kecamatan price/m', weight='bold')
axarr[0].set_position([0.1, 0.1, 0.3, 0.8])
axarr[1].set_position([0.6, 0.1, 0.3, 0.8])

from the price/m, bsd is still one of highest price/m

Code
df.Kondisi = df.Kondisi.map(value_mapping)
Code
df['TK'] = df.KMR + df.KMD
df.drop(columns=['KMR','KMD'], inplace=True)
Code
df['avg_price'] = df.groupby(['Kecamatan','Kondisi'])['price/m'].transform('median')
Code
df['rstd'] = df.groupby(['Kecamatan','Kondisi'])['price/m'].transform(lambda x: x.std() * 100 / x.mean())
Code
df1 = df[df.Kondisi == 1]
df2 = df[df.Kondisi == 2]

fig, axarr = plt.subplots(1,2, figsize=(10, 4))
data = df1[['Kecamatan','rstd']].drop_duplicates().sort_values('rstd', ascending=False).head()
sns.barplot(data = data, x='rstd', y='Kecamatan', ax = axarr[0])
sns.histplot(data = df1.rstd.drop_duplicates(), ax = axarr[1])
sns.histplot(data = df2.rstd.drop_duplicates(), ax = axarr[1], alpha = 0.5, legend='a')
axarr[0].set_title('Top 5 highest kecamatan price variability', weight='bold')
axarr[1].set_title('r-std.dev price/m per kecamatan', weight='bold')
axarr[0].yaxis.set_tick_params(labelsize=10)

hand2 = [mpatches.Rectangle((0, 0), 1, 1, color='blue', label='Unfurnished')]
hand1 = [mpatches.Rectangle((0, 0), 1, 1, color='orange', label='Furnished')]
legend1 = plt.legend(handles = hand2, loc='upper right', labelcolor='blue')
legend2 = plt.legend(handles = hand1, loc='upper left', labelcolor='orange')
plt.gca().add_artist(legend1)
plt.show()

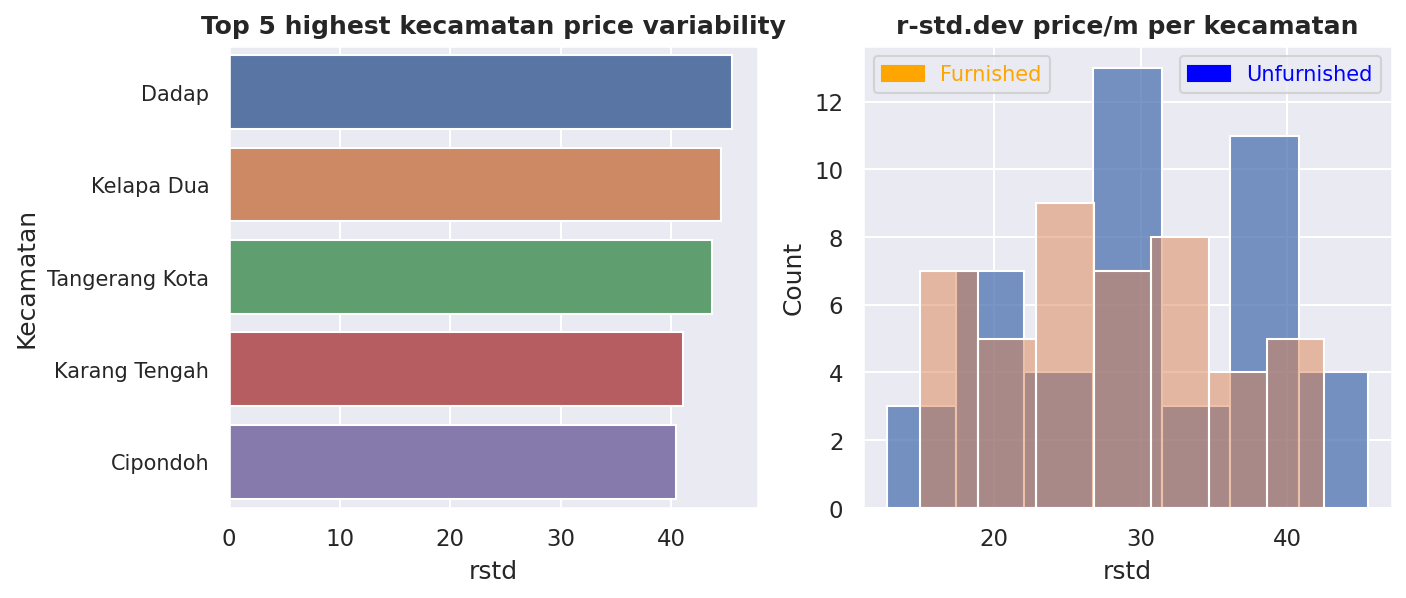
R-std, which stands for relative standard deviation, is a valuable tool for assessing variability and making comparisons between datasets. In the displayed plot, we observe that the r-std is distributed within a substantial 30% range. When the price exhibits a high r-std, it typically indicates an insufficient number of samples or a failure to account for critical factors influencing price fluctuations.

Code
#create a variable to contain avg_price information from the data to be used by test data
avg = df[['Kecamatan','Kondisi','avg_price']].drop_duplicates()
Code
#remove columns that are no longer needed
df9 = df.copy()
df = df.drop(columns=['Kecamatan','price/m','rstd'])
Code
#encoding
df['komplek'] =  df[['komplek']].apply(lambda x: 1 if x.komplek == 'ya' else 0, axis = 1)
Code
#create a variable to contain result from all combination
final_result = pd.DataFrame(index = ['mae','mape','rmse','r2'])

Modelling Combination 1

For the first combination, I will utilize all available features and apply linear regression.

Code
dfc1 = df.copy().reset_index(drop=True)
Code
dfc1.info()
<class 'pandas.core.frame.DataFrame'>
RangeIndex: 13428 entries, 0 to 13427
Data columns (total 9 columns):
 #   Column     Non-Null Count  Dtype  
---  ------     --------------  -----  
 0   price      13428 non-null  int64  
 1   komplek    13428 non-null  int64  
 2   Listrik    13428 non-null  int64  
 3   Lantai     13428 non-null  int64  
 4   Kondisi    13428 non-null  int64  
 5   LB         13428 non-null  int64  
 6   LT         13428 non-null  int64  
 7   TK         13428 non-null  int64  
 8   avg_price  13428 non-null  float64
dtypes: float64(1), int64(8)
memory usage: 944.3 KB
Code
X_train, X_test, y_train, y_test = train_test_split(dfc1.drop(columns='price'), dfc1.price.to_numpy(), test_size = 0.2, random_state=129)
X_train = X_train.reset_index(drop=True)
X_test = X_test.reset_index(drop=True)
Code
model = LinearRegression()
model.fit(X_train, y_train)
LinearRegression()
In a Jupyter environment, please rerun this cell to show the HTML representation or trust the notebook.
On GitHub, the HTML representation is unable to render, please try loading this page with nbviewer.org.
Code
y_pred_test = model.predict(X_test)
y_pred_train = model.predict(X_train)
Code
result = pd.DataFrame()
mae_test = mean_absolute_error(y_test, y_pred_test)
mape_test = mean_absolute_percentage_error(y_test, y_pred_test)
rmse_test = np.sqrt(mean_squared_error(y_test, y_pred_test))
r2_test = r2_score(y_test, y_pred_test)

mae_train = mean_absolute_error(y_train, y_pred_train)
mape_train = mean_absolute_percentage_error(y_train, y_pred_train)
rmse_train = np.sqrt(mean_squared_error(y_train, y_pred_train))
r2_train = r2_score(y_train, y_pred_train)

result['test_OLS'] = [mae_test, mape_test, rmse_test, r2_test]
result['train_OLS'] = [mae_train, mape_train, rmse_train, r2_train]
result.index = ['mae','mape','rmse','r2']
Code
result
test_OLS train_OLS
mae 532.715149 541.468771
mape 0.278840 0.329897
rmse 800.262693 805.231411
r2 0.797440 0.794544

Above is the result of the base model.

Code
final_result = pd.concat([final_result, result], axis = 1)

Modelling Combination 2

In this second combination, I intend to enhance model complexity by incorporating polynomial features. If overfitting concerns arise, I will address them by applying ridge regression.

Code
dfc2 = df.copy().reset_index(drop=True) 
Code
dfc2.info()
<class 'pandas.core.frame.DataFrame'>
RangeIndex: 13428 entries, 0 to 13427
Data columns (total 9 columns):
 #   Column     Non-Null Count  Dtype  
---  ------     --------------  -----  
 0   price      13428 non-null  int64  
 1   komplek    13428 non-null  int64  
 2   Listrik    13428 non-null  int64  
 3   Lantai     13428 non-null  int64  
 4   Kondisi    13428 non-null  int64  
 5   LB         13428 non-null  int64  
 6   LT         13428 non-null  int64  
 7   TK         13428 non-null  int64  
 8   avg_price  13428 non-null  float64
dtypes: float64(1), int64(8)
memory usage: 944.3 KB
Code
scaler = MinMaxScaler()
df1 = scaler.fit_transform(dfc2.drop(columns=['price']))
df1 = pd.DataFrame(df1, columns = dfc2.drop(columns=['price']).columns)
df1['price'] = dfc2.price
dfc2 = df1.copy()
Code
X_train, X_test, y_train, y_test = train_test_split(dfc2.drop(columns='price'), dfc2.price.to_numpy(), test_size=0.2, random_state=129)
Code
result = pd.DataFrame()
for x in [2,3,4]:
    poly_features = PolynomialFeatures(degree=x)
    X_poly = poly_features.fit_transform(X_train)
    X_train_poly, X_test_poly, y_train_poly, y_test_poly = train_test_split(X_poly, y_train, test_size=0.2, random_state=129)

    model = LinearRegression()
    model.fit(X_train_poly, y_train_poly)

    y_pred_test = model.predict(X_test_poly)
    y_pred_train = model.predict(X_train_poly)

    mae_test = mean_absolute_error(y_test_poly, y_pred_test)
    rmse_test = np.sqrt(mean_squared_error(y_test_poly, y_pred_test))
    r2_test = r2_score(y_test_poly, y_pred_test)

    mae_train = mean_absolute_error(y_train_poly, y_pred_train)
    rmse_train = np.sqrt(mean_squared_error(y_train_poly, y_pred_train))
    r2_train = r2_score(y_train_poly, y_pred_train)

    result[f'test_{x}'] = [mae_test, rmse_test, r2_test]
    result[f'train_{x}'] = [mae_train, rmse_train, r2_train]

result.index = ['mae','rmse','r2']
result
test_2 train_2 test_3 train_3 test_4 train_4
mae 472.915901 481.615889 472.519472 464.954008 501.537211 442.182946
rmse 712.046550 738.563833 719.862027 705.295298 834.318214 660.588687
r2 0.837082 0.827754 0.833486 0.842922 0.776326 0.862204

I tested a polynomial degree of 3, and the results indicate a minor degree of overfitting. However, when I increased it to degree 4, the model exhibited a severe overfitting issue.

Code
result = pd.DataFrame()
for x in [3,4]:
    poly_features = PolynomialFeatures(degree=x)
    X_poly = poly_features.fit_transform(X_train)
    X_train_poly, X_test_poly, y_train_poly, y_test_poly = train_test_split(X_poly, y_train, test_size=0.2, random_state=129)

    for alpha in [0.01, 0.1, 1., 10]:
        model = Ridge(alpha=alpha)
        model.fit(X_train_poly, y_train_poly)

        y_pred_test = model.predict(X_test_poly)
        y_pred_train = model.predict(X_train_poly)

        mae_test = mean_absolute_error(y_test_poly, y_pred_test)
        rmse_test = np.sqrt(mean_squared_error(y_test_poly, y_pred_test))
        r2_test = r2_score(y_test_poly, y_pred_test)

        mae_train = mean_absolute_error(y_train_poly, y_pred_train)
        rmse_train = np.sqrt(mean_squared_error(y_train_poly, y_pred_train))
        r2_train = r2_score(y_train_poly, y_pred_train)

        result[f'test_{x}_{alpha}'] = [mae_test, rmse_test, r2_test]
        result[f'train_{x}_{alpha}'] = [mae_train, rmse_train, r2_train]

result.index = ['mae','rmse','r2']
result
test_3_0.01 train_3_0.01 test_3_0.1 train_3_0.1 test_3_1.0 train_3_1.0 test_3_10 train_3_10 test_4_0.01 train_4_0.01 test_4_0.1 train_4_0.1 test_4_1.0 train_4_1.0 test_4_10 train_4_10
mae 467.342704 466.439950 464.299064 470.035509 470.187015 478.290378 484.975821 490.051383 464.840133 456.548113 462.897803 463.601116 466.596826 473.665648 481.134291 487.347859
rmse 704.461373 708.507262 698.403249 717.934342 707.437585 731.792609 726.156035 749.558649 706.885343 690.605679 695.774749 704.905074 700.618287 723.246246 720.228905 743.215049
r2 0.840534 0.841488 0.843265 0.837242 0.839184 0.830898 0.830561 0.822587 0.839435 0.849397 0.844443 0.843096 0.842270 0.834824 0.833316 0.825578

I attempted to use ridge regression to tackle overfitting on highly polynomial features, but the outcome wasn’t superior to simply using a polynomial degree of 2 without any regularization.

Code
poly_features = PolynomialFeatures(degree=2)
X_train = poly_features.fit_transform(X_train)
X_test = poly_features.fit_transform(X_test)
Code
model = LinearRegression()
model.fit(X_train, y_train)
LinearRegression()
In a Jupyter environment, please rerun this cell to show the HTML representation or trust the notebook.
On GitHub, the HTML representation is unable to render, please try loading this page with nbviewer.org.
Code
y_pred_test = model.predict(X_test)
y_pred_train = model.predict(X_train)
Code
result = pd.DataFrame()
mae_test = mean_absolute_error(y_test, y_pred_test)
mape_test = mean_absolute_percentage_error(y_test, y_pred_test)
rmse_test = np.sqrt(mean_squared_error(y_test, y_pred_test))
r2_test = r2_score(y_test, y_pred_test)

mae_train = mean_absolute_error(y_train, y_pred_train)
mape_train = mean_absolute_percentage_error(y_train, y_pred_train)
rmse_train = np.sqrt(mean_squared_error(y_train, y_pred_train))
r2_train = r2_score(y_train, y_pred_train)

result['test_PolyRidgeOLS'] = [mae_test, mape_test, rmse_test, r2_test]
result['train_PolyRidgeOLS'] = [mae_train, mape_train, rmse_train, r2_train]
result.index = ['mae','mape','rmse','r2']
Code
result
test_PolyRidgeOLS train_PolyRidgeOLS
mae 471.090238 478.917020
mape 0.227019 0.276395
rmse 729.230240 732.438213
r2 0.831804 0.830011

The model is not overfitting and the result is better than the base model

Code
final_result = pd.concat([final_result, result], axis = 1)

Modelling Combination 3

Let’s try to log transform skewed features and use linear regression.

Code
dfc3 = df.copy().reset_index(drop=True)
Code
column = ['LB','LT','TK']
for col in column:
    dfc3[col] = np.log(dfc3[col])
Code
dfc3.info()
<class 'pandas.core.frame.DataFrame'>
RangeIndex: 13428 entries, 0 to 13427
Data columns (total 9 columns):
 #   Column     Non-Null Count  Dtype  
---  ------     --------------  -----  
 0   price      13428 non-null  int64  
 1   komplek    13428 non-null  int64  
 2   Listrik    13428 non-null  int64  
 3   Lantai     13428 non-null  int64  
 4   Kondisi    13428 non-null  int64  
 5   LB         13428 non-null  float64
 6   LT         13428 non-null  float64
 7   TK         13428 non-null  float64
 8   avg_price  13428 non-null  float64
dtypes: float64(4), int64(5)
memory usage: 944.3 KB
Code
X_train, X_test, y_train, y_test = train_test_split(dfc3.drop(columns='price'), dfc3.price.to_numpy(), test_size = 0.2, random_state=129)
X_train = X_train.reset_index(drop=True)
X_test = X_test.reset_index(drop=True)
Code
model = LinearRegression()
model.fit(X_train, y_train)
LinearRegression()
In a Jupyter environment, please rerun this cell to show the HTML representation or trust the notebook.
On GitHub, the HTML representation is unable to render, please try loading this page with nbviewer.org.
Code
y_pred_test = model.predict(X_test)
y_pred_train = model.predict(X_train)
Code
result = pd.DataFrame()
mae_test = mean_absolute_error(y_test, y_pred_test)
mape_test = mean_absolute_percentage_error(y_test, y_pred_test)
rmse_test = np.sqrt(mean_squared_error(y_test, y_pred_test))
r2_test = r2_score(y_test, y_pred_test)

mae_train = mean_absolute_error(y_train, y_pred_train)
mape_train = mean_absolute_percentage_error(y_train, y_pred_train)
rmse_train = np.sqrt(mean_squared_error(y_train, y_pred_train))
r2_train = r2_score(y_train, y_pred_train)

result['test_LogOLS'] = [mae_test, mape_test, rmse_test, r2_test]
result['train_LogOLS'] = [mae_train, mape_train, rmse_train, r2_train]
result.index = ['mae','mape','rmse','r2']
Code
result
test_LogOLS train_LogOLS
mae 583.179251 595.413840
mape 0.329967 0.394927
rmse 835.080845 841.121663
r2 0.779431 0.775821

The results show a performance decline compared to using Linear Regression on the original, untransformed features.

Code
final_result = pd.concat([final_result, result], axis = 1)

Modelling Combination 4

For this combination, let’s try XGBRegressor

Code
dfc4 = df.copy()
Code
dfc4.info()
<class 'pandas.core.frame.DataFrame'>
Index: 13428 entries, 0 to 17049
Data columns (total 9 columns):
 #   Column     Non-Null Count  Dtype  
---  ------     --------------  -----  
 0   price      13428 non-null  int64  
 1   komplek    13428 non-null  int64  
 2   Listrik    13428 non-null  int64  
 3   Lantai     13428 non-null  int64  
 4   Kondisi    13428 non-null  int64  
 5   LB         13428 non-null  int64  
 6   LT         13428 non-null  int64  
 7   TK         13428 non-null  int64  
 8   avg_price  13428 non-null  float64
dtypes: float64(1), int64(8)
memory usage: 1.0 MB
Code
X_train, X_test, y_train, y_test = train_test_split(dfc4.drop(columns='price'), dfc4.price.to_numpy(), test_size = 0.2, random_state=129)
X_train = X_train.reset_index(drop=True)
X_test = X_test.reset_index(drop=True)
Code
xgb_regressor = XGBRegressor(
    objective='reg:squarederror',  
    eval_metric='rmse',           
    random_state=42               
)
Code
param_grid = {  
    'learning_rate': [0.001, 0.01],  
    'n_estimators': [100, 400, 900, 1000],  
    'max_depth': [3, 4],  
    'eval_metric': ['rmse'],  
}
Code
grid_search = GridSearchCV(
    estimator=xgb_regressor,
    param_grid=param_grid,
    scoring='neg_mean_squared_error',  
    cv=5,                              
    verbose=1,                         
    n_jobs=-1                           
)
Code
grid_search.fit(X_train, y_train)
Fitting 5 folds for each of 16 candidates, totalling 80 fits
GridSearchCV(cv=5,
             estimator=XGBRegressor(base_score=None, booster=None,
                                    callbacks=None, colsample_bylevel=None,
                                    colsample_bynode=None,
                                    colsample_bytree=None, device=None,
                                    early_stopping_rounds=None,
                                    enable_categorical=False,
                                    eval_metric='rmse', feature_types=None,
                                    gamma=None, grow_policy=None,
                                    importance_type=None,
                                    interaction_constraints=None,
                                    learning_rate=None...
                                    max_depth=None, max_leaves=None,
                                    min_child_weight=None, missing=nan,
                                    monotone_constraints=None,
                                    multi_strategy=None, n_estimators=None,
                                    n_jobs=None, num_parallel_tree=None,
                                    random_state=42, ...),
             n_jobs=-1,
             param_grid={'eval_metric': ['rmse'],
                         'learning_rate': [0.001, 0.01], 'max_depth': [3, 4],
                         'n_estimators': [100, 400, 900, 1000]},
             scoring='neg_mean_squared_error', verbose=1)
In a Jupyter environment, please rerun this cell to show the HTML representation or trust the notebook.
On GitHub, the HTML representation is unable to render, please try loading this page with nbviewer.org.
Code
best_params_xgb = grid_search.best_params_
Code
best_params_xgb
{'eval_metric': 'rmse',
 'learning_rate': 0.01,
 'max_depth': 4,
 'n_estimators': 1000}
Code
xgboost = XGBRegressor(**best_params_xgb, random_state=42)
Code
xgboost.fit(X_train, y_train)
XGBRegressor(base_score=None, booster=None, callbacks=None,
             colsample_bylevel=None, colsample_bynode=None,
             colsample_bytree=None, device=None, early_stopping_rounds=None,
             enable_categorical=False, eval_metric='rmse', feature_types=None,
             gamma=None, grow_policy=None, importance_type=None,
             interaction_constraints=None, learning_rate=0.01, max_bin=None,
             max_cat_threshold=None, max_cat_to_onehot=None,
             max_delta_step=None, max_depth=4, max_leaves=None,
             min_child_weight=None, missing=nan, monotone_constraints=None,
             multi_strategy=None, n_estimators=1000, n_jobs=None,
             num_parallel_tree=None, random_state=42, ...)
In a Jupyter environment, please rerun this cell to show the HTML representation or trust the notebook.
On GitHub, the HTML representation is unable to render, please try loading this page with nbviewer.org.
Code
y_pred_test = xgboost.predict(X_test)
y_pred_train = xgboost.predict(X_train)
Code
result = pd.DataFrame()
mae_test = mean_absolute_error(y_test, y_pred_test)
mape_test = mean_absolute_percentage_error(y_test, y_pred_test)
rmse_test = np.sqrt(mean_squared_error(y_test, y_pred_test))
r2_test = r2_score(y_test, y_pred_test)

mae_train = mean_absolute_error(y_train, y_pred_train)
mape_train = mean_absolute_percentage_error(y_train, y_pred_train)
rmse_train = np.sqrt(mean_squared_error(y_train, y_pred_train))
r2_train = r2_score(y_train, y_pred_train)

result['test_XGB'] = [mae_test, mape_test, rmse_test, r2_test]
result['train_XGB'] = [mae_train, mape_train, rmse_train, r2_train]
result.index = ['mae','mape','rmse','r2']
Code
result
test_XGB train_XGB
mae 438.290716 419.337764
mape 0.213093 0.253128
rmse 678.516114 626.639712
r2 0.854384 0.875573

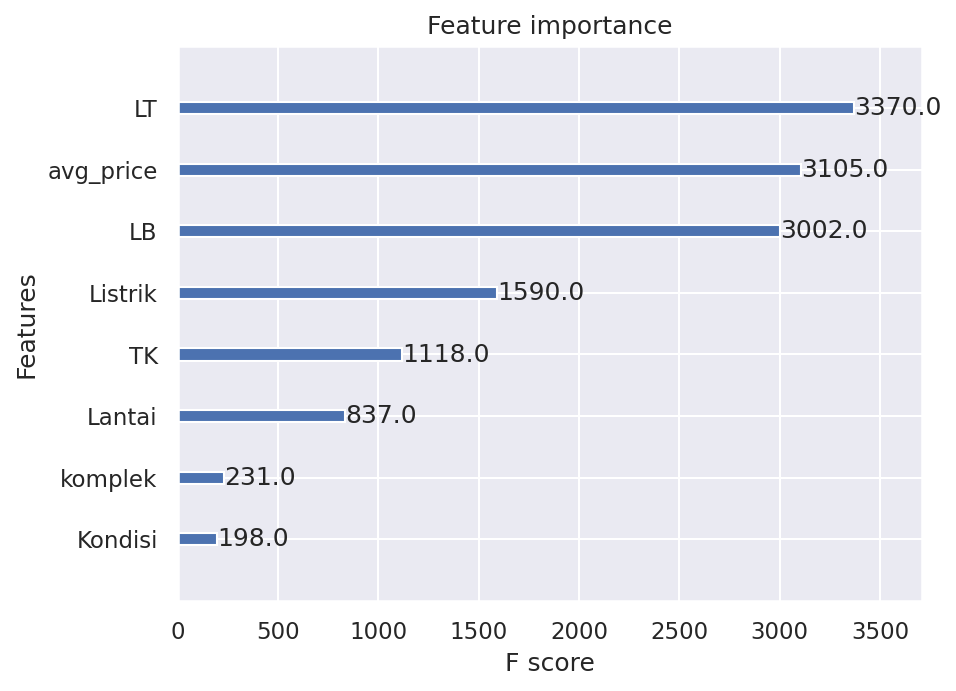
The model is little overfit. But this is the best model so far

Code
final_result = pd.concat([final_result, result], axis = 1)
Code
xgb.plot_importance(xgboost)  # You can also use 'gain' or 'cover' for importance_type
plt.show()

Modelling Combination 5

I will use RandomForest on this combination. But using RandomForest model on this case is very computational expensive because of many continuous features.

Code
dfc5 = df.copy().reset_index(drop=True) #df[['LT','avg_price','distance','LB','Listrik','price']]
Code
dfc5.info()
<class 'pandas.core.frame.DataFrame'>
RangeIndex: 13428 entries, 0 to 13427
Data columns (total 9 columns):
 #   Column     Non-Null Count  Dtype  
---  ------     --------------  -----  
 0   price      13428 non-null  int64  
 1   komplek    13428 non-null  int64  
 2   Listrik    13428 non-null  int64  
 3   Lantai     13428 non-null  int64  
 4   Kondisi    13428 non-null  int64  
 5   LB         13428 non-null  int64  
 6   LT         13428 non-null  int64  
 7   TK         13428 non-null  int64  
 8   avg_price  13428 non-null  float64
dtypes: float64(1), int64(8)
memory usage: 944.3 KB
Code
X_train, X_test, y_train, y_test = train_test_split(dfc5.drop(columns='price'), dfc5.price.to_numpy(), test_size = 0.2, random_state=129)
X_train = X_train.reset_index(drop=True)
X_test = X_test.reset_index(drop=True)
Code
randomforest = RandomForestRegressor(random_state=42)
Code
param_grid = {
    'n_estimators': [600],
    'max_depth': [8, 7],
    'min_samples_split': [10, 50, 100],
}
Code
grid_search = GridSearchCV(estimator=randomforest, param_grid=param_grid, cv=5, n_jobs=-1)
Code
grid_search.fit(X_train, y_train)
GridSearchCV(cv=5, estimator=RandomForestRegressor(random_state=42), n_jobs=-1,
             param_grid={'max_depth': [8, 7],
                         'min_samples_split': [10, 50, 100],
                         'n_estimators': [600]})
In a Jupyter environment, please rerun this cell to show the HTML representation or trust the notebook.
On GitHub, the HTML representation is unable to render, please try loading this page with nbviewer.org.
Code
best_params_rf = grid_search.best_params_
Code
best_params_rf
{'max_depth': 8, 'min_samples_split': 10, 'n_estimators': 600}
Code
rf = RandomForestRegressor(**best_params_rf, random_state=42)
Code
rf.fit(X_train, y_train)
RandomForestRegressor(max_depth=8, min_samples_split=10, n_estimators=600,
                      random_state=42)
In a Jupyter environment, please rerun this cell to show the HTML representation or trust the notebook.
On GitHub, the HTML representation is unable to render, please try loading this page with nbviewer.org.
Code
y_pred_test = rf.predict(X_test)
y_pred_train = rf.predict(X_train)
Code
result = pd.DataFrame()
mae_test = mean_absolute_error(y_test, y_pred_test)
mape_test = mean_absolute_percentage_error(y_test, y_pred_test)
rmse_test = np.sqrt(mean_squared_error(y_test, y_pred_test))
r2_test = r2_score(y_test, y_pred_test)

mae_train = mean_absolute_error(y_train, y_pred_train)
mape_train = mean_absolute_percentage_error(y_train, y_pred_train)
rmse_train = np.sqrt(mean_squared_error(y_train, y_pred_train))
r2_train = r2_score(y_train, y_pred_train)

result['test_RF'] = [mae_test, mape_test, rmse_test, r2_test]
result['train_RF'] = [mae_train, mape_train, rmse_train, r2_train]
result.index = ['mae','mape','rmse','r2']
Code
result
test_RF train_RF
mae 438.359894 399.306010
mape 0.216506 0.243069
rmse 687.059730 599.451504
r2 0.850694 0.886136

The result is more or less the same with XGBoost model.

Code
final_result = pd.concat([final_result, result], axis = 1)

Modelling Combination 6

For this last combination, let’s see how AdaBoost perform.

Code
dfc6 = df.copy().reset_index(drop=True) #df[['LT','avg_price','distance','LB','Listrik','price']]
Code
dfc6.info()
<class 'pandas.core.frame.DataFrame'>
RangeIndex: 13428 entries, 0 to 13427
Data columns (total 9 columns):
 #   Column     Non-Null Count  Dtype  
---  ------     --------------  -----  
 0   price      13428 non-null  int64  
 1   komplek    13428 non-null  int64  
 2   Listrik    13428 non-null  int64  
 3   Lantai     13428 non-null  int64  
 4   Kondisi    13428 non-null  int64  
 5   LB         13428 non-null  int64  
 6   LT         13428 non-null  int64  
 7   TK         13428 non-null  int64  
 8   avg_price  13428 non-null  float64
dtypes: float64(1), int64(8)
memory usage: 944.3 KB
Code
X_train, X_test, y_train, y_test = train_test_split(dfc5.drop(columns='price'), dfc5.price.to_numpy(), test_size = 0.2, random_state=129)
X_train = X_train.reset_index(drop=True)
X_test = X_test.reset_index(drop=True)
Code
adaboost = AdaBoostRegressor(random_state = 42)
Code
param_grid = {
    'n_estimators': [50, 150, 250],
    'learning_rate': [0.01, 0.1, 1, 0.001]
}
Code
grid_search = GridSearchCV(estimator=adaboost, param_grid=param_grid, cv=5, n_jobs=-1)
Code
grid_search.fit(X_train, y_train)
GridSearchCV(cv=5, estimator=AdaBoostRegressor(random_state=42), n_jobs=-1,
             param_grid={'learning_rate': [0.01, 0.1, 1, 0.001],
                         'n_estimators': [50, 150, 250]})
In a Jupyter environment, please rerun this cell to show the HTML representation or trust the notebook.
On GitHub, the HTML representation is unable to render, please try loading this page with nbviewer.org.
Code
best_params_ada = grid_search.best_params_
Code
best_params_ada
{'learning_rate': 0.1, 'n_estimators': 50}
Code
ada = AdaBoostRegressor(**best_params_ada, random_state=42)
Code
ada.fit(X_train, y_train)
AdaBoostRegressor(learning_rate=0.1, random_state=42)
In a Jupyter environment, please rerun this cell to show the HTML representation or trust the notebook.
On GitHub, the HTML representation is unable to render, please try loading this page with nbviewer.org.
Code
y_pred_test = ada.predict(X_test)
y_pred_train = ada.predict(X_train)
Code
result = pd.DataFrame()
mae_test = mean_absolute_error(y_test, y_pred_test)
mape_test = mean_absolute_percentage_error(y_test, y_pred_test)
rmse_test = np.sqrt(mean_squared_error(y_test, y_pred_test))
r2_test = r2_score(y_test, y_pred_test)

mae_train = mean_absolute_error(y_train, y_pred_train)
mape_train = mean_absolute_percentage_error(y_train, y_pred_train)
rmse_train = np.sqrt(mean_squared_error(y_train, y_pred_train))
r2_train = r2_score(y_train, y_pred_train)

result['test_ADA'] = [mae_test, mape_test, rmse_test, r2_test]
result['train_ADA'] = [mae_train, mape_train, rmse_train, r2_train]
result.index = ['mae','mape','rmse','r2']
Code
result
test_ADA train_ADA
mae 574.532983 580.901639
mape 0.329233 0.398783
rmse 838.365578 816.508925
r2 0.777692 0.788748
Code
final_result = pd.concat([final_result, result], axis = 1)

Choosing The Best Combination

Let’s use the best combination

Code
final_result
test_OLS train_OLS test_PolyRidgeOLS train_PolyRidgeOLS test_LogOLS train_LogOLS test_XGB train_XGB test_RF train_RF test_ADA train_ADA
mae 532.715149 541.468771 471.090238 478.917020 583.179251 595.413840 438.290716 419.337764 438.359894 399.306010 574.532983 580.901639
mape 0.278840 0.329897 0.227019 0.276395 0.329967 0.394927 0.213093 0.253128 0.216506 0.243069 0.329233 0.398783
rmse 800.262693 805.231411 729.230240 732.438213 835.080845 841.121663 678.516114 626.639712 687.059730 599.451504 838.365578 816.508925
r2 0.797440 0.794544 0.831804 0.830011 0.779431 0.775821 0.854384 0.875573 0.850694 0.886136 0.777692 0.788748

By seeing the results, 2 best models are XGBoost and RandomForrest. I’ll go with XGBoost because it way more less computational than RandomForest

Code
#choosing only the most important features for XGB
df = df[['LT','LB','Listrik','price','avg_price']]

X_train, X_test, y_train, y_test = train_test_split(df.drop(columns='price'), df.price.to_numpy(), test_size = 0.2, random_state=123)
X_train = X_train.reset_index(drop=True)
X_test = X_test.reset_index(drop=True)
Code
best_xgb_regressor = XGBRegressor(**best_params_xgb, random_state=42)
Code
best_xgb_regressor.fit(X_train, y_train)
XGBRegressor(base_score=None, booster=None, callbacks=None,
             colsample_bylevel=None, colsample_bynode=None,
             colsample_bytree=None, device=None, early_stopping_rounds=None,
             enable_categorical=False, eval_metric='rmse', feature_types=None,
             gamma=None, grow_policy=None, importance_type=None,
             interaction_constraints=None, learning_rate=0.01, max_bin=None,
             max_cat_threshold=None, max_cat_to_onehot=None,
             max_delta_step=None, max_depth=4, max_leaves=None,
             min_child_weight=None, missing=nan, monotone_constraints=None,
             multi_strategy=None, n_estimators=1000, n_jobs=None,
             num_parallel_tree=None, random_state=42, ...)
In a Jupyter environment, please rerun this cell to show the HTML representation or trust the notebook.
On GitHub, the HTML representation is unable to render, please try loading this page with nbviewer.org.
Code
y_pred_test = best_xgb_regressor.predict(X_test)
y_pred_train = best_xgb_regressor.predict(X_train)
Code
result = pd.DataFrame()
mae_test = mean_absolute_error(y_test, y_pred_test)
mape_test = mean_absolute_percentage_error(y_test, y_pred_test)
rmse_test = np.sqrt(mean_squared_error(y_test, y_pred_test))
r2_test = r2_score(y_test, y_pred_test)

mae_train = mean_absolute_error(y_train, y_pred_train)
mape_train = mean_absolute_percentage_error(y_train, y_pred_train)
rmse_train = np.sqrt(mean_squared_error(y_train, y_pred_train))
r2_train = r2_score(y_train, y_pred_train)

result['test_XGB'] = [mae_test, mape_test, rmse_test, r2_test]
result['train_XGB'] = [mae_train, mape_train, rmse_train, r2_train]
result.index = ['mae','mape','rmse','r2']
Code
result
test_XGB train_XGB
mae 459.897612 429.131317
mape 0.307846 0.244483
rmse 699.862902 643.969481
r2 0.846041 0.868387

The results remain favorable and consistent

Model Evaluation & Interpretation

Here, I will assess and interpret the model’s performance using a new set of sample data that I collected separately from the main dataset.

Code
test = pd.read_csv('test.csv')
test = pd.merge(test, avg , on=['Kecamatan','Kondisi']).convert_dtypes()

Add the avg_price column to test data.

Code
test = test[(test.price < 10000) & (test.price > 100)]
test = test[test.LB < 900]
test = test[test.LT < 500]
test = test[['LT','avg_price','LB','Listrik','price']]

Clean the test data

Code
test_x = test[['LT','LB','Listrik','avg_price']]
test_y = test.price
Code
y_pred_test = best_xgb_regressor.predict(test_x)
y_test = test_y
Code
result = pd.DataFrame()
mae_test = mean_absolute_error(y_test, y_pred_test)
mape_test = mean_absolute_percentage_error(y_test, y_pred_test)
rmse_test = np.sqrt(mean_squared_error(y_test, y_pred_test))
r2_test = r2_score(y_test, y_pred_test)

mae_train = mean_absolute_error(y_train, y_pred_train)
mape_train = mean_absolute_percentage_error(y_train, y_pred_train)
rmse_train = np.sqrt(mean_squared_error(y_train, y_pred_train))
r2_train = r2_score(y_train, y_pred_train)

result['test_XGB'] = [mae_test, mape_test, rmse_test, r2_test]
result['train_XGB'] = [mae_train, mape_train, rmse_train, r2_train]
result.index = ['mae','mape','rmse','r2']
Code
result
test_XGB train_XGB
mae 531.780306 429.131317
mape 0.214570 0.244483
rmse 885.063409 643.969481
r2 0.785323 0.868387

The model perform worse on scrapped test data.

Residuals Plot

Code
res = pd.DataFrame([list(y_train), list(y_pred_train)]).transpose()
res.columns = ['test','pred']
res['residual'] = res.test - res.pred
res['residualp'] = abs(res.test - res.pred) * 100 / res.test
Code
fig = px.scatter(x=res['test'], y=res['residualp'])
fig.update_layout( 
    height = 800,
    title = 'Residual\'s absolute percentage plot'
)
fig.add_hline(y=res['residualp'].mean(), line_dash="dot", line_color="red")
fig

From the residual percentage above we can see that :
1. 7.5% of data is APE that is more than 50%.
2. 59% of data is APE that is lower than 20%.
3. 32.5% of data is ape that is 20% - 50%.
4. When the houses prices is 4 million, the model become worse as the price kept going up.
5. There are extreme APE error on 0 to 2k prices, this indicate that there are anomalies data inserted.

Code
fig = px.scatter(x=res['test'], y=res['residual'])
fig.update_layout(  
    height = 700,
    title = 'Residuals plot'
)
fig.add_hline(y=0, line_dash="dot", line_color="red")
fig

The unequal variance in the data implies the presence of heteroscedasticity, and a higher price is associated with increased variability. This phenomenon is considered normal since more expensive houses involve a greater number of factors in determining their prices. Additionally, the model also consistently underpredicts as house prices increase. I think we need to gather more variables or predictors that influence house prices.

PDP & ICE Plots

Code
def pdp_ice_plot(model, df_test, column, clusters=True):
    df_test = df_test.copy()
    pdp_isolate = pdp.PDPIsolate(model = model, df = df_test, 
                      num_grid_points=20,
                      model_features = df_test.columns, 
                      feature = column, feature_name=column, n_classes=0)
    pdp_isolate.plot(
                center=True, plot_lines=True,
                cluster=clusters, n_cluster_centers=5,cluster_method='accurate',
                plot_pts_dist=False, to_bins=True,
                show_percentile=False, which_classes=None,
                figsize=(10,6), dpi=300,
                ncols=2, plot_params={"pdp_hl": True},
                engine='matplotlib', template='plotly_white')
    
    plt.show()
    return pdp_isolate
Code
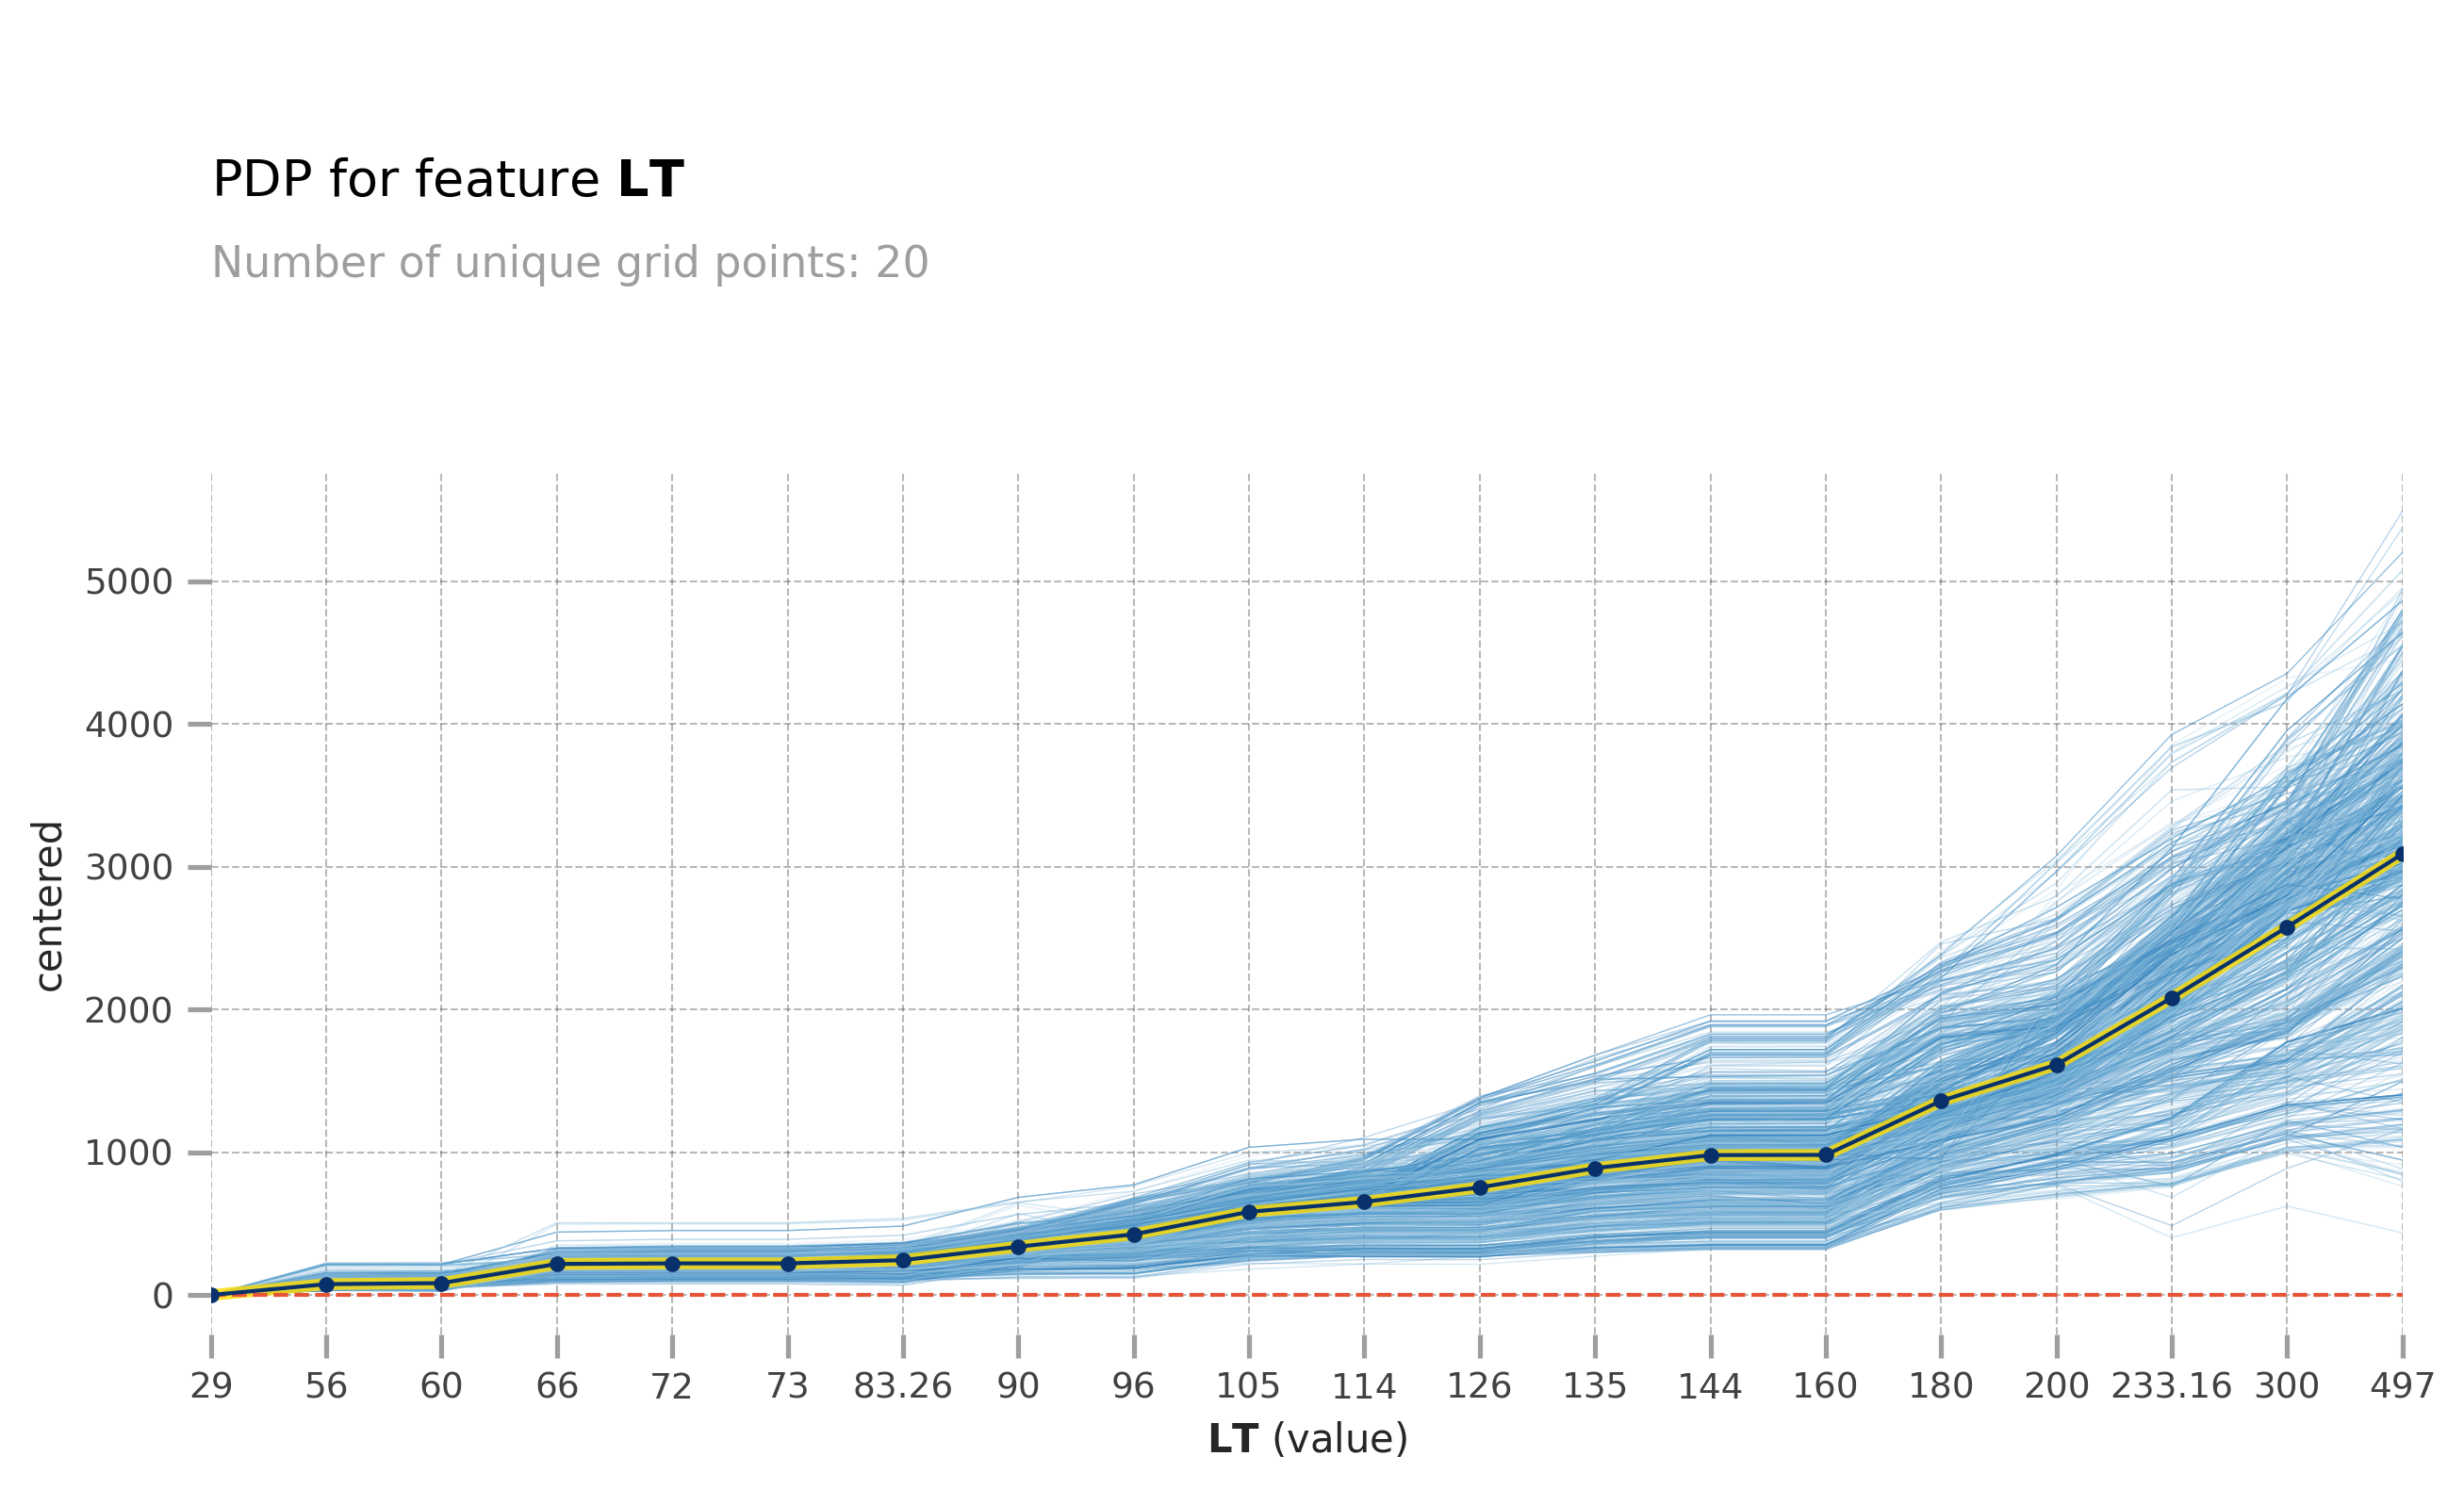
pdp_ice_plot(best_xgb_regressor, test_x, 'LT', clusters=False)
obtain pred_func from the provided model.

<pdpbox.pdp.PDPIsolate at 0x7f92d07a8a30>

The Larger the LT, higher the price. But as the LT get higher, the price is also more disperse.

Code
test1 = test_x.copy()
pdp_interact = pdp.PDPInteract(model=best_xgb_regressor, df=test1,
                              num_grid_points=10,
                              model_features = test1.columns, 
                              features=['LB','avg_price'], 
                              feature_names=['LB','avg_price'], n_classes=0)
obtain pred_func from the provided model.
Code
pdp_ice_plot(best_xgb_regressor, test_x, 'avg_price', clusters=True)
obtain pred_func from the provided model.

<pdpbox.pdp.PDPIsolate at 0x7f92c44449d0>

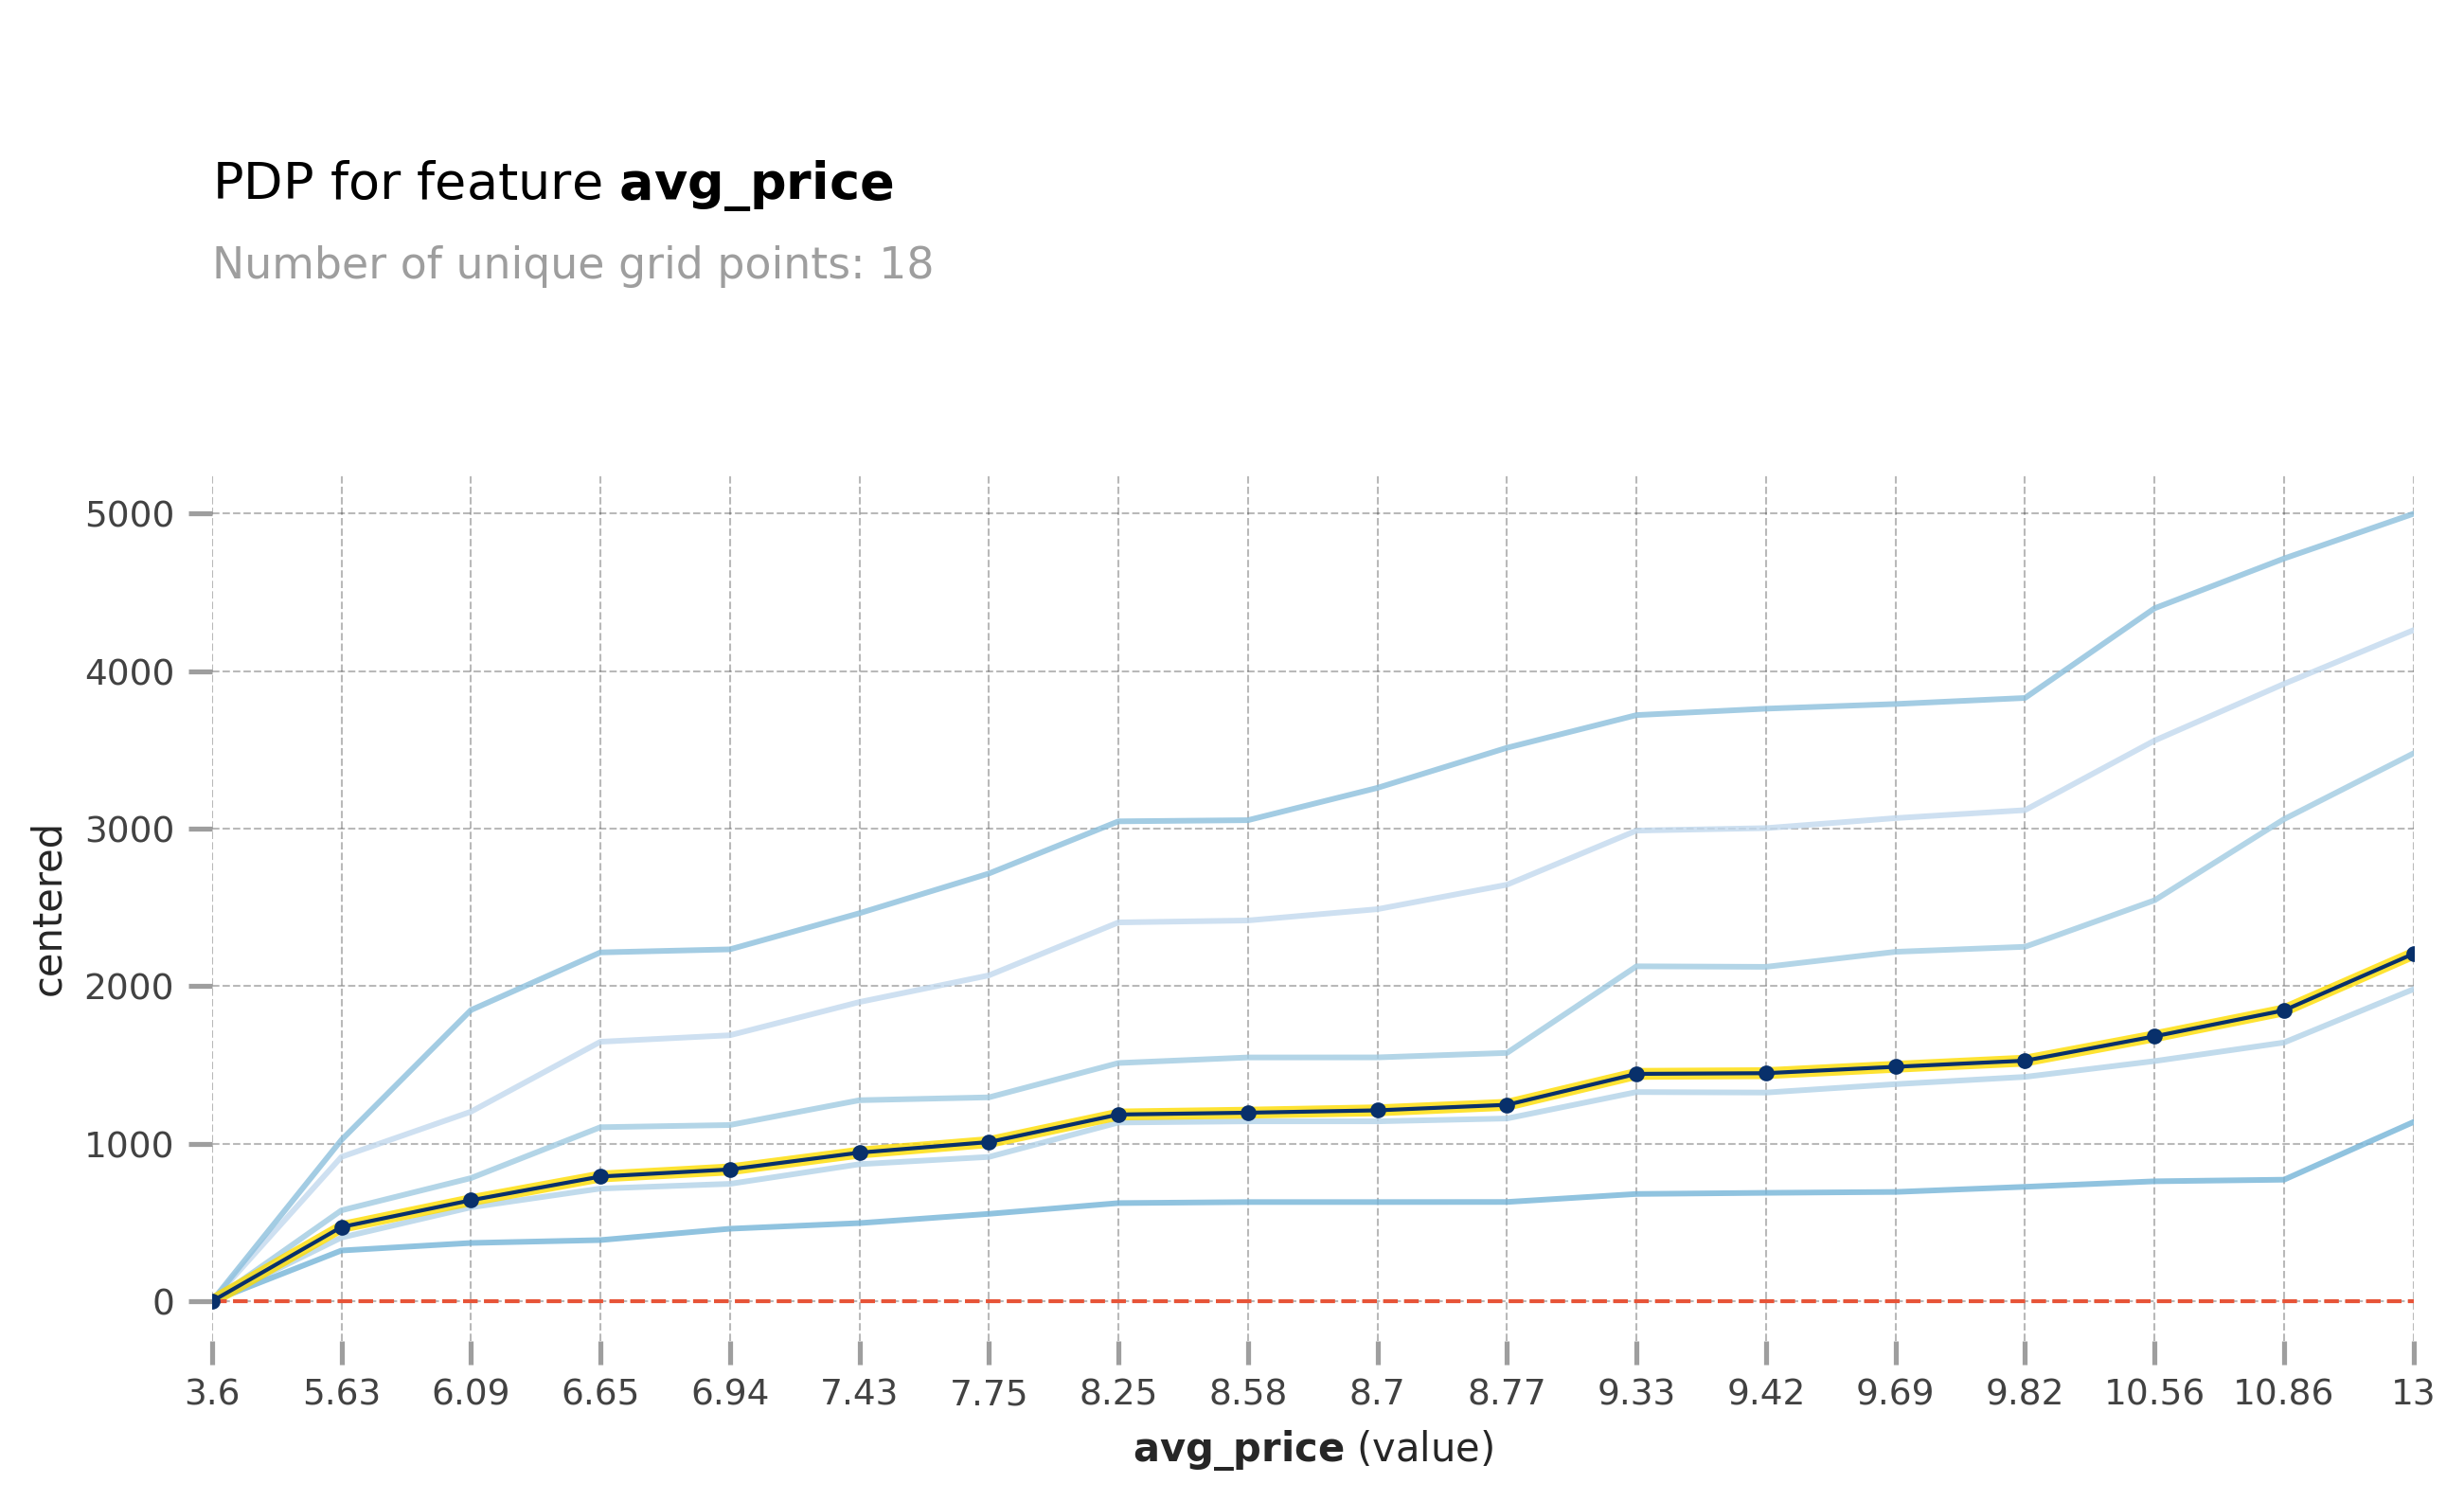
The higher the avg_price, also the higher the price, but not all data is affected the same, some are highly affected, some are less affected.

Code
fig, axes = pdp_interact.plot(
    plot_type="grid",
    to_bins=True,
    plot_pdp=True,
    show_percentile=True,
    which_classes=None,
    figsize=None,
    dpi=300,
    ncols=2,
    plot_params=None,
    engine="plotly",
    template="plotly_white",
)
fig

By combining the avg_price and the LT, you can see that low LT is not affected as much as it affect high LT. The price is more volatile on higher LT.

Conclusion

I have concerns regarding the model’s accuracy, primarily because the residuals are still to be relatively high. This issue can be attributed to the limited sample size and the exclusion of critical factors influencing prices. Among these factors, ‘avg_price’ is of utmost importance. To enhance the accuracy of ‘avg_price,’ it’s imperative to expand the sample size and consider a broader spectrum of variables affecting prices. While I’ve used ‘Kecamatan’ and ‘Kondisi Perabotan’ in this context to estimate ‘avg_price,’ I believe these variables alone are insufficient. Moving forward, I plan to further develop this project by gathering additional data from various real estate websites to create a more robust and accurate model.